Coverage maps: различия между версиями
Нет описания правки |
Нет описания правки |
||
| (не показаны 2 промежуточные версии этого же участника) | |||
| Строка 10: | Строка 10: | ||
[[File:2024-01-19_16-33.png|thumb|800px|center]] | [[File:2024-01-19_16-33.png|thumb|800px|center]] | ||
Different layers can be displayed on the map. The selected layers are saved individually for each operator and are displayed again when the map is opened. Additional layers can be [[Additional marks for equipment/lines|output marks]] on equipment/lines of communication. It is possible to display infrastructure numbers ([[Communications installations| | Different layers can be displayed on the map. The selected layers are saved individually for each operator and are displayed again when the map is opened. Additional layers can be [[Additional marks for equipment/lines|output marks]] on equipment/lines of communication. It is possible to display infrastructure numbers ([[Communications installations|Nodes]]/Poles/Manholes/Fiber Optical Junction Boxes) or houses and place your own arbitrary inscriptions. | ||
[[File:2024-01-19_16-37.png|thumb|800px|center]] | [[File:2024-01-19_16-37.png|thumb|800px|center]] | ||
| Строка 18: | Строка 18: | ||
[[File:2024-01-19_16-38.png|thumb|800px|center]] | [[File:2024-01-19_16-38.png|thumb|800px|center]] | ||
You can add new infrastructure objects directly from the coverage map. Switch to the editing mode - [[ | You can add new infrastructure objects directly from the coverage map. Switch to the editing mode - [[Communications installations]], Fiber Optical Junction Boxes, Poles, Manholes are available. After selecting the object type mark its location on the map and fill in the properties table. | ||
[[File:2024-01-19_16-39.png|thumb|800px|center]] | [[File:2024-01-19_16-39.png|thumb|800px|center]] | ||
| Строка 110: | Строка 110: | ||
'''Starting from version 3.19:''' | '''Starting from version 3.19:''' | ||
<span id="anchor_319_07_EN">A right-click context menu has been added to the coverage map for a building (edit, change coordinates, building plan and logic diagram</span> | <span id="anchor_319_07_EN">A right-click context menu has been added to the coverage map for a building (edit, change coordinates, building plan and logic diagram)</span> | ||
[[File:2024-04-29 15-59.png|thumb|800px|center]] | [[File:2024-04-29 15-59.png|thumb|800px|center]] | ||
| Строка 123: | Строка 123: | ||
<span id="anchor_319_11_EN">When pointing to a cable line on the coverage map, the table with fiber commutation is displayed in the tooltip (disabled parameter in the setting)</span> | <span id="anchor_319_11_EN">When pointing to a cable line on the coverage map, the table with fiber commutation is displayed in the tooltip (disabled parameter in the setting)</span> | ||
[[File:2024-04-29 16-07.png|thumb|800px|center]] | [[File:2024-04-29 16-07.png|thumb|800px|center]] | ||
| Строка 154: | Строка 152: | ||
== Addition of objects == | == Addition of objects == | ||
In the "Covering" menu you can add links to [[ | In the "Covering" menu you can add links to [[Settings - Maps and plans|your maps]]. To do this, go to "Settings" - "Maps", select <big>+</big>" Add a map". You can also add other objects: | ||
See: [[Adding a line from a coverage map]] | See: [[Adding a line from a coverage map]] | ||
See: [[Adding buildings from the coverage map]] | See: [[Adding buildings from the coverage map]] | ||
Текущая версия от 11:07, 8 ноября 2024
Main Menu - Covering
Coverage maps are an extremely visual demonstration of network operation. In the ERP "UserSide" you can enter maps of the areas of operation and specify the location of buildings and communications installations. When hovering over an object, the basic information about it is displayed and clicking on it opens the corresponding object card. There is a colour selection of houses depending on activity: inactive houses are displayed in red, active ones - in green. Display of objects on the map is dynamic. Only those objects that should be on the operator's screen are displayed. When shifting the map/scale change - the required objects are loaded. This approach allows to put all settlements and objects on one map at once. Map files are cached by the server for a period of 2 months from the date of the first download. This makes it possible to work with maps even with problems of the external Internet channel and allows to distribute the load.
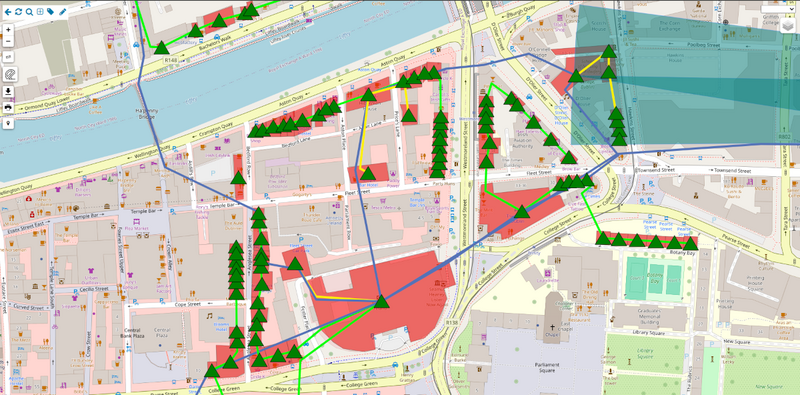
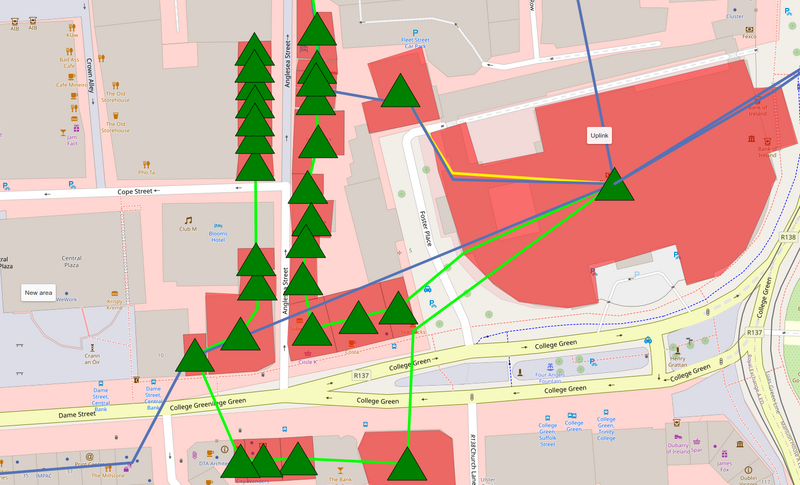
Different layers can be displayed on the map. The selected layers are saved individually for each operator and are displayed again when the map is opened. Additional layers can be output marks on equipment/lines of communication. It is possible to display infrastructure numbers (Nodes/Poles/Manholes/Fiber Optical Junction Boxes) or houses and place your own arbitrary inscriptions.
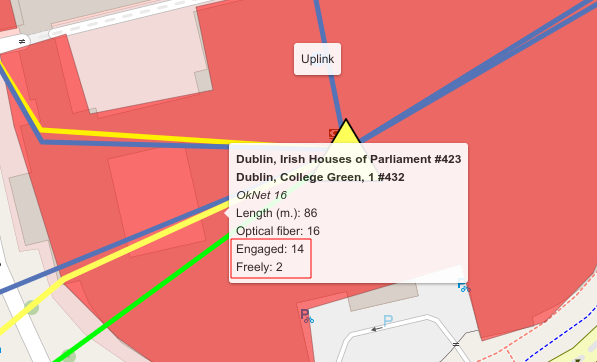
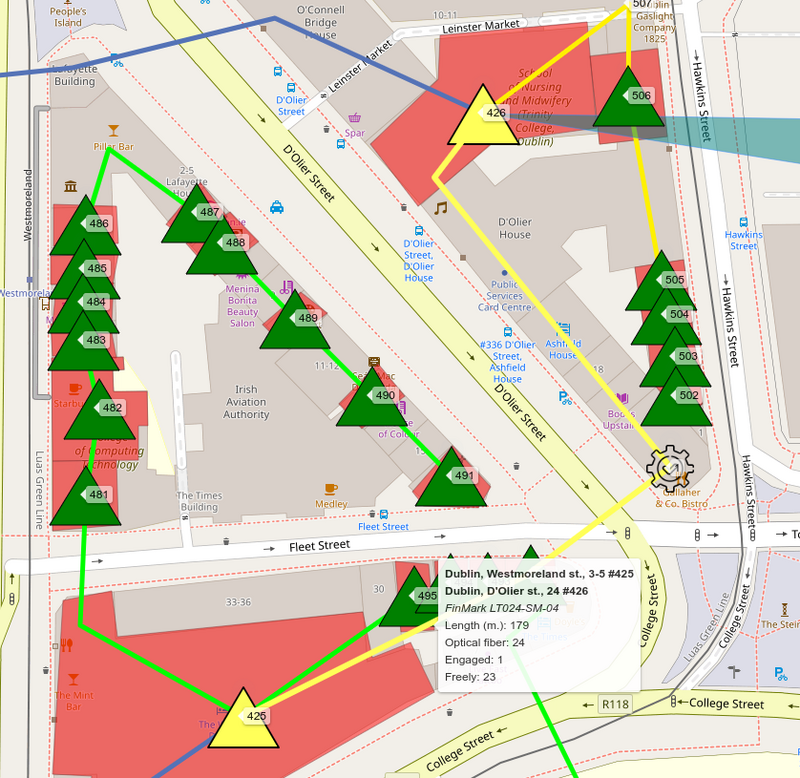
Starting from version 3.17 the number of occupied and free optical fibres is displayed on the map in the optical cable line tooltip.
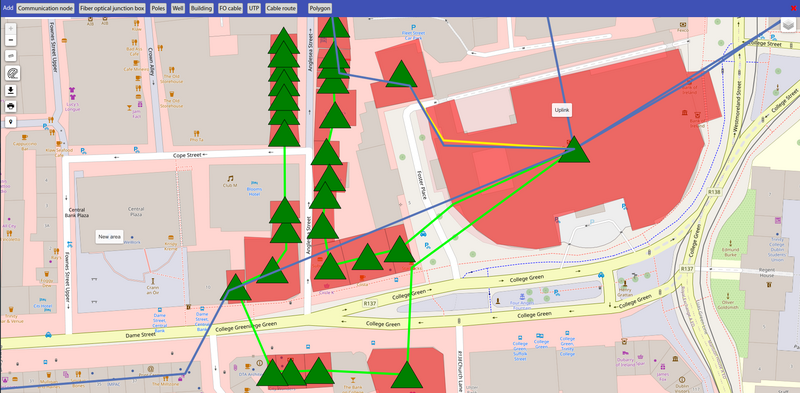
You can add new infrastructure objects directly from the coverage map. Switch to the editing mode - Communications installations, Fiber Optical Junction Boxes, Poles, Manholes are available. After selecting the object type mark its location on the map and fill in the properties table.
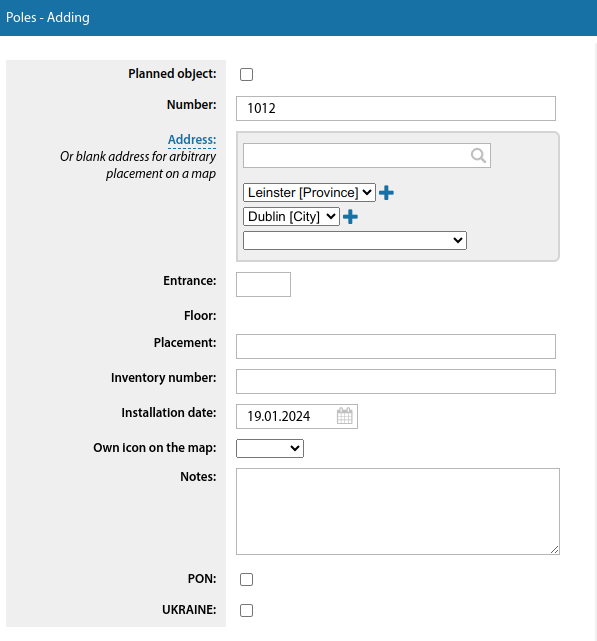
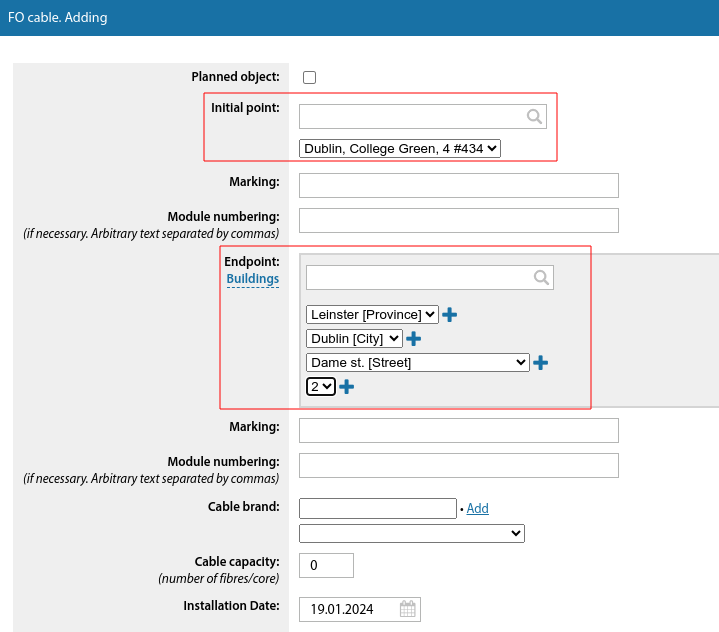
Starting from version 3.17 it is possible to add cable lines between communication facilities and buildings (previously only between communication installations) from the coverage map.
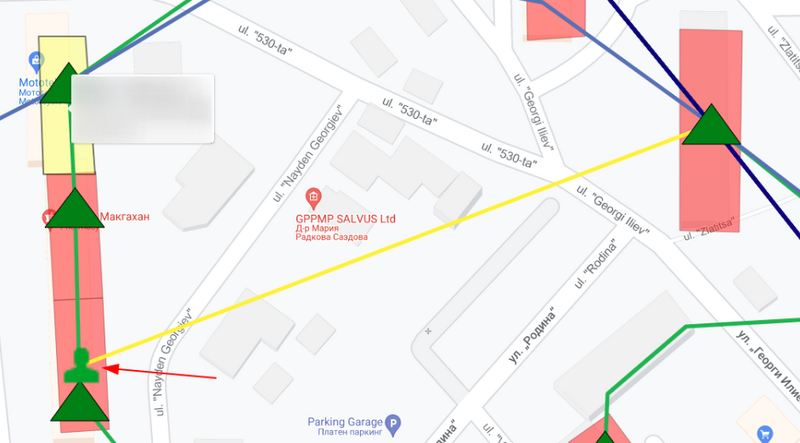
On the map, cable lines that extend to the user are drawn to the coordinates of the user (not to the user's building as before) (since version 3.17).
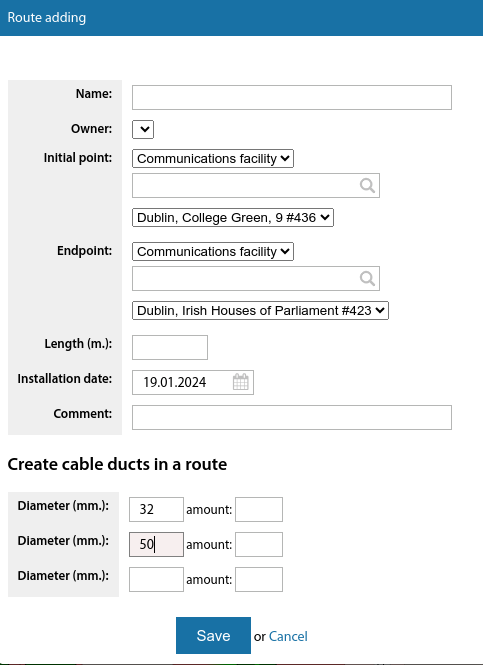
Cable ducts are now much faster to document. Traces can be added directly from the coverage map, and the form for adding a trace offers to create three types of cable ducts in it at the same time.
Added setting option "Display of inscriptions on the map as footnotes" (from version 3.17).
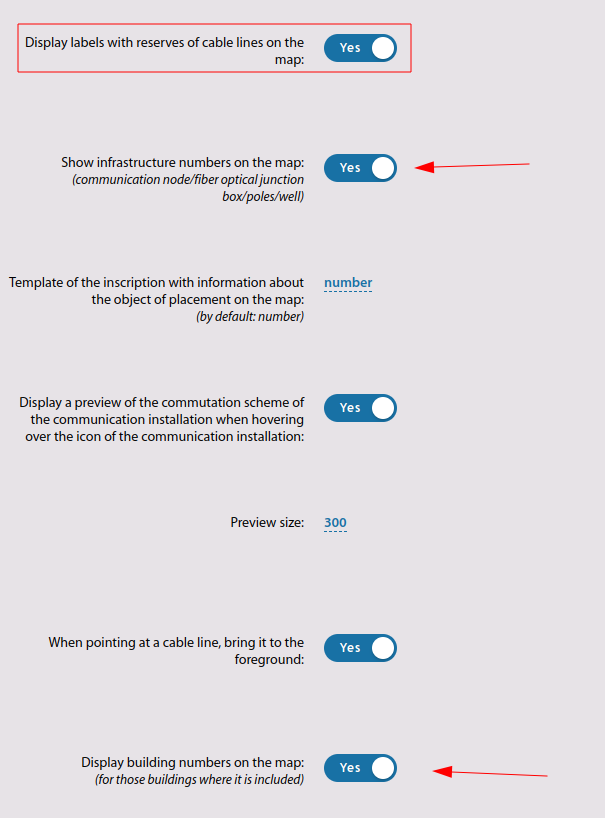
It allows to enable/disable inscriptions on the map as footnotes.
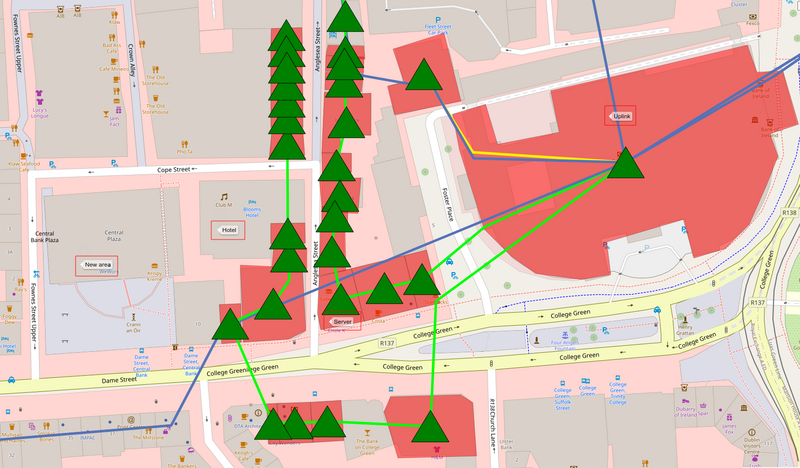
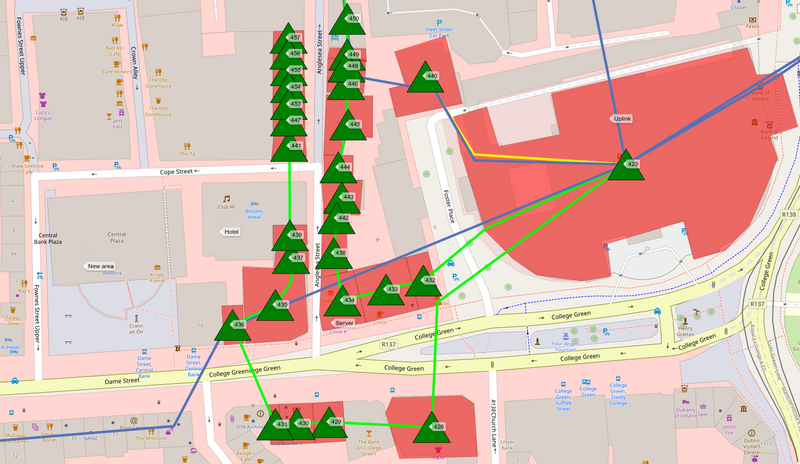
Inscriptions on the map in the form of footnotes can be of different types. In the form of created "Inscriptions", numbers of infrastructure objects:(communication node/fiber optical junction box/poles/well), numbers of buildings:(for those buildings where it is included). Setting up their display is done in the section "Settings-Main-Covering".
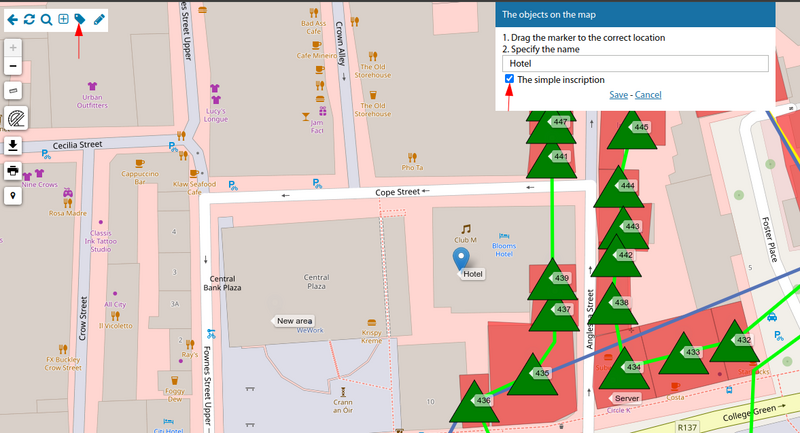
Creation of inscriptions on the map in the form of footnotes is performed by clicking on the "Inscriptions" button (in the upper left corner). And adding an inscription with the "Simple Inscription" mark.
On the map it is now possible to copy the coordinates under the cursor to the clipboard when right-clicking (from version 3.17).
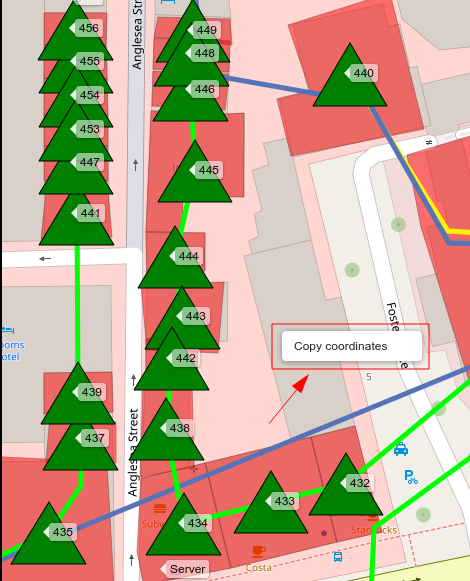
Starting from version 3.18:
When adding a communication installation from the map - the required building is substituted if the communication installation is added on it.
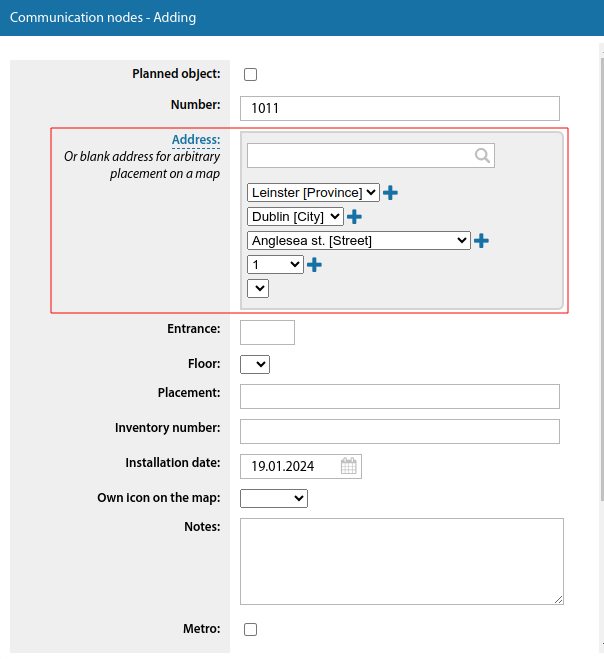
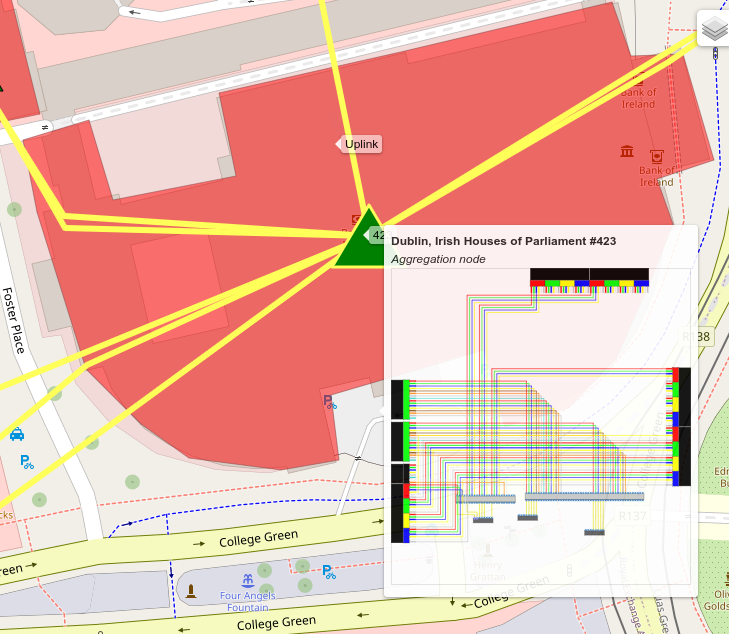
It is now possible to display a preview of the switching scheme of a communication installation in a tooltip when hovering over the icon of a communication installation on the coverage map.
If you click on the icon of a communication installation on the coverage map with the Alt key pressed - not the card of the communication installation, but the switching scheme of this communication installation will be opened.
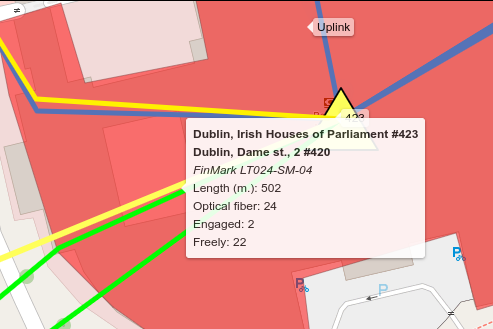
On the coverage map in the tooltip on the cable line - the number of free fibres is displayed taking into account that fibres that have been degraded or ODF/cross-switched are not considered occupied if they are not terminated by the equipment.
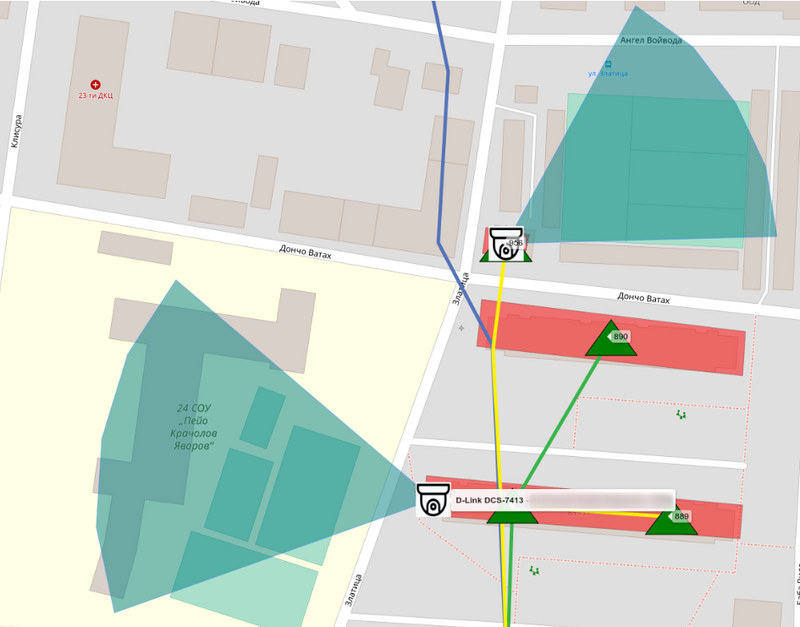
The map now also shows the radio equipment sectors of users (and other devices that can be displayed on the map, e.g. surveillance cameras).
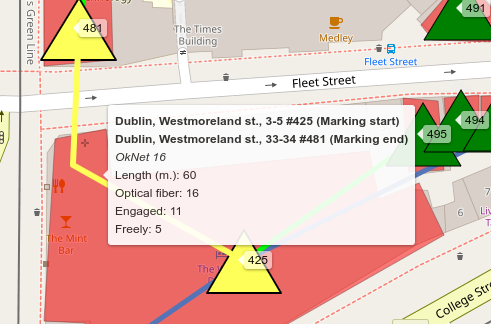
In the coverage map, a tooltip for a cable line displays the markings at the ends of that line.
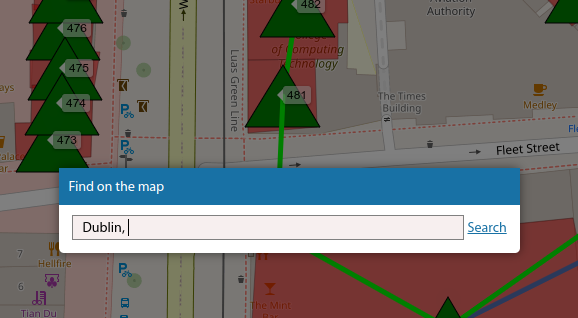
When you open the map from the left menu from under a specific address object - the map search form will offer this address object in the search bar.
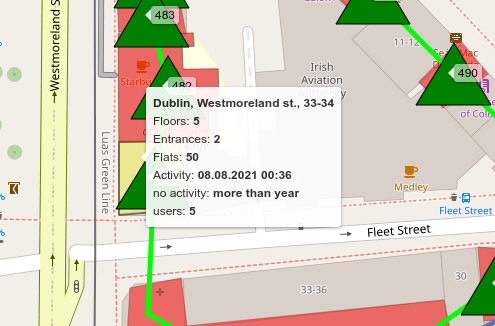
When you hover over a building on the map, a tooltip displays information on the number of flats, floors and entrances.
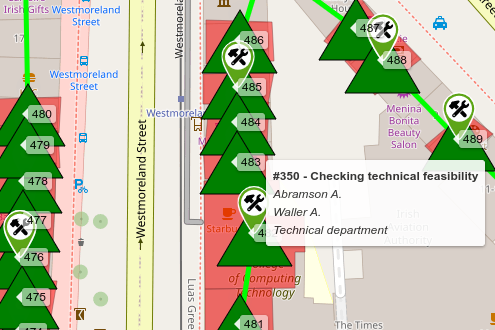
When you hover over a task icon on the coverage map, the tooltip also displays the executors and units for the task.
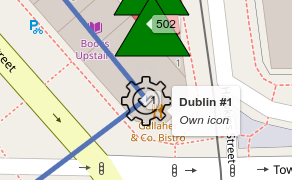
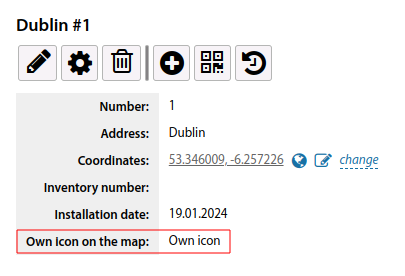
If a communication installation has its own icon on the map, the name of this icon will be displayed in the communication installation card and in the tooltip on the map.
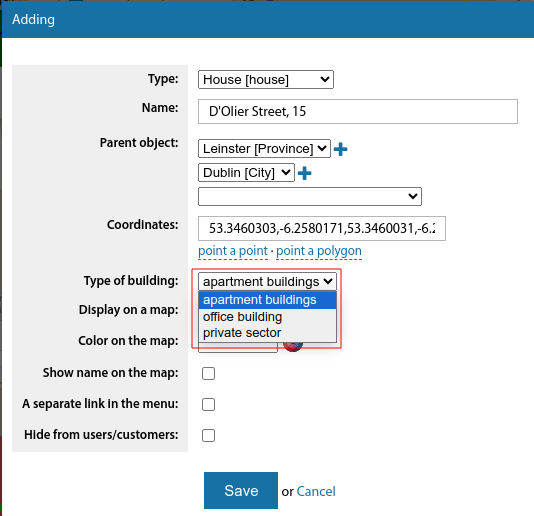
In the add building dialogue box, you can select the building type immediately.
On the coverage map, when you hover over a cable line, it is not only highlighted but also comes to the foreground.
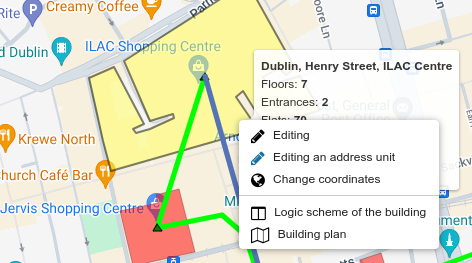
Starting from version 3.19:
A right-click context menu has been added to the coverage map for a building (edit, change coordinates, building plan and logic diagram)
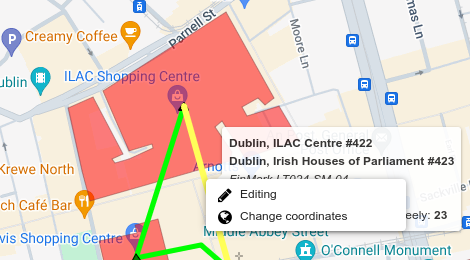
A right-click context menu has been added to the coverage map for cable lines (edit, change coordinates)
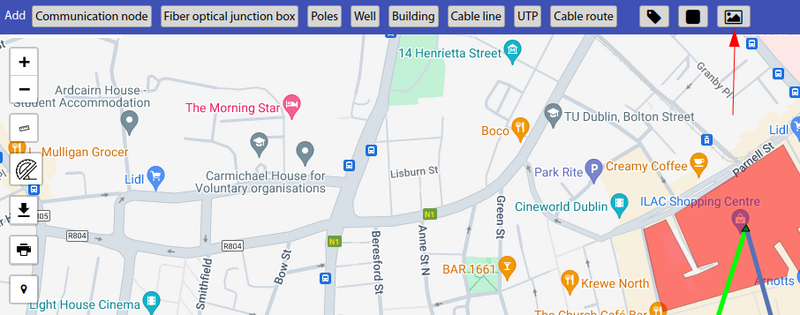
New type of objects on the map - Image
When pointing to a cable line on the coverage map, the table with fiber commutation is displayed in the tooltip (disabled parameter in the setting)

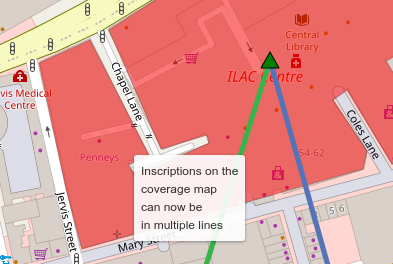
Inscriptions on the coverage map can now be in multiple lines
Polygons
To visually highlight any zones on the map, you can use the functionality of arbitrary polygons. For example, to highlight zones where the company can include users, where it cannot include users, and where it is only collecting applications for inclusion.
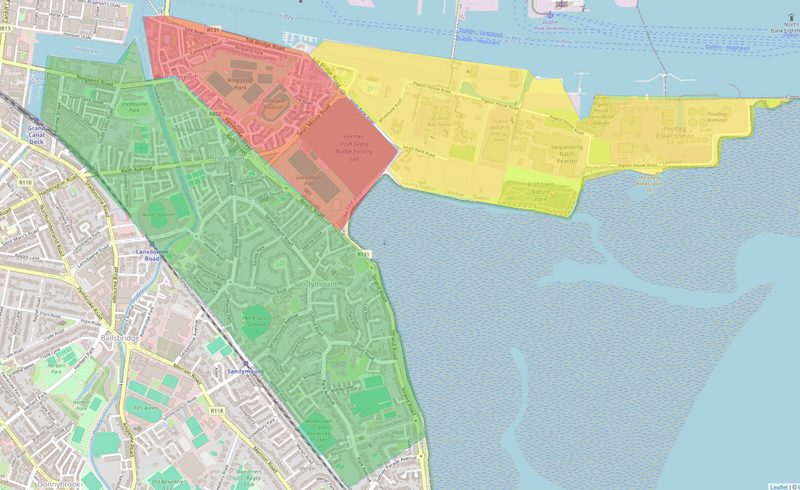
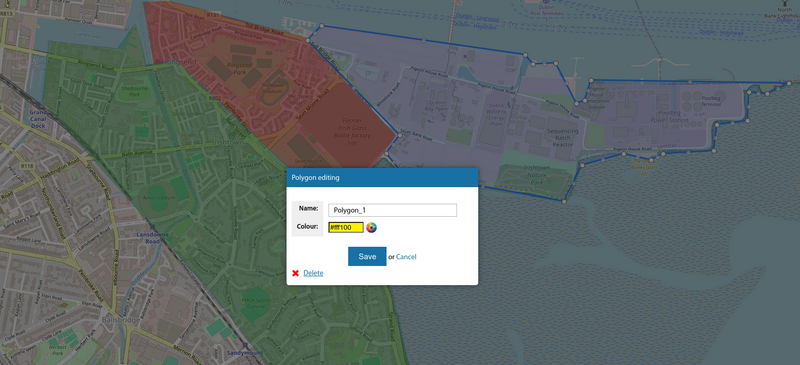
Polygons are added directly from the coverage map, have arbitrary coordinates, colours and a tooltip
Maps tiles
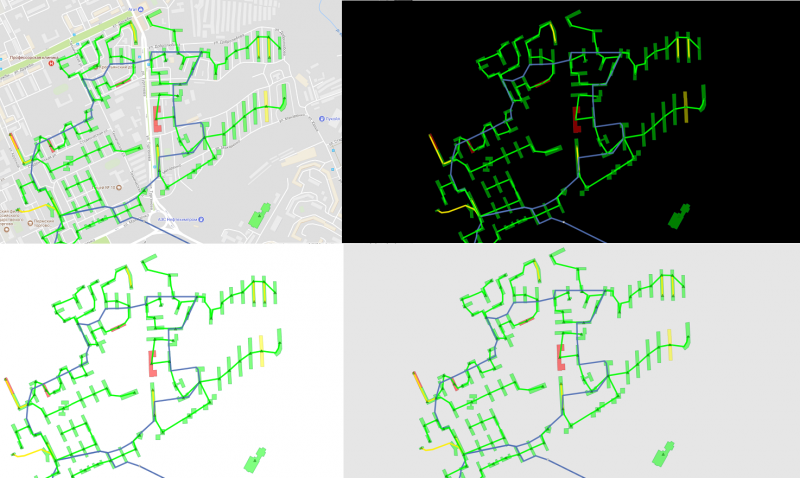
The maps contain a variety of tiles from different mapping systems. It is also possible to switch to black/white/grey underlay to view the network layout directly without being distracted by the mapping information.
Addition of objects
In the "Covering" menu you can add links to your maps. To do this, go to "Settings" - "Maps", select +" Add a map". You can also add other objects: