Usm observer EN
|
This function is one of the possibilities |
usm_observer - is a module for constant control by SNMP means of configurable indicators of devices and notification of employees and departments about the fact of these indicators' values exceeding the set values.
This module is a replacement for the obsolete us_control_EN module
Overview
Module Language: Python 3.5
Current version: see page: Modules_EN
Module Status: Paid
Python3 Required Modules:
PySNMP
All dependencies are installed automatically. To do this, while in the module directory, execute:
pip3 install -r requirements.txt
Installing the module
Upload the module to the server in the modules directory and run (X.X.X is the current version number)
unzip usm_observer-vX.X.X.zip
rm usm_observer-vX.X.X.zip
cd usm_observer
Upgrade the package manager
pip3 install --upgrade pip
Now install the dependencies. You can use virtual python environment with the appropriate patches to the commands below, or install everything according to these instructions globally.
pip3 install --upgrade -r requirements.txt
If this is an initial installation - copy the example configuration file
cp settings.ini-example settings.ini
Configuring the module
The settings.ini configuration file contains two sections with parameters
The api section contains parameters of connection to the USERSIDE API:
- url - specify here the URL USERSIDE
- key - specify here the API Key
- ssl_verify - if you want to disable SSL certificate verification, set the value to no
The log section contains parameters for logging the module operation:
- path - path to the directory where the log file will be created
- level - level of detail: 1 - debugging, 2 - informational, 3 - warnings, 4 - errors, 5 - fatal errors
- to_console - yes - output log messages to the console but not to a file; no - output log messages to a file
Test launch
To verify that the configuration is correct, perform a manual test launch. To do this, set level = 1 and to_console = yes in the log section of settings.ini and then launch the module manually by executing the following command:
python3 usm_observer.py
If the module worked correctly and terminated correctly, set level = 2 and to_console = no and configure the module to start automatically.
If errors were detected during the manual test launch, eliminate them or contact our support service for help using the ticket system in your personal client cabinet.
Automatic startup
Configure the startup in crontab as follows. Pay attention to output redirection - preferably the files to which the output is redirected should be located in the same directory as the module's log file.
Add a line to crontab, having previously changed the path to the module:
* * * * * root python3 /path/to/module/usm_observer.py >> /var/log/userside/usm_observer_cron.log 2>>/var/log/userside/usm_observer_cron_error.log
Make sure that the module starts. To do this, observe the log file after one minute:
tail -f /var/log/userside/usm_observer.log
If the module does not start automatically, the problem may be that there are no paths to python3 in crontab. Add the path to the PATH variable of the crontab file or specify the full path to python3 in the job line.
You can find the full path to python3 by running the command:
which python3
Log file rotation
The log files created by the module need to be rotated. To do this, the standard log rotation tools in the operating system should be used.
The following configuration will rotate all *.log files every day and store 7 archive copies (for 7 days)
Rotation on FreeBSD
On FreeBSD, the newsyslog daemon is responsible for rotation. Create the file /usr/local/etc/newsyslog.conf.d/userside, in which place the following line (don't forget the path if you changed it):
/var/log/userside/*.log 644 7 * @T00 GJC
Rotation on Linux
On Linux, the logrotate daemon is responsible for rotation. Create a file /etc/logrotate.d/userside, in which put the following text (don't forget the path if you change it):
/var/log/userside/*.log {
    rotate 7
    daily
    compress
    delaycompress
    missingok
    notifempty
}
Operation Logic
- Each launch the module checks the status of SNMP-parameters of the monitored devices. If the value of a parameter is out of limits, an alarm is considered to have occurred. There can be several alarm parameters on a device. For each device, where an alarming parameter was found or vice versa - the parameter came back to normal - an e-mail and/or SMS is generated for the selected (at the level of each device) circle of recipients
- A separate e-mail/message is generated for each device, which will contain all the parameters whose (alarm/normal) status has changed. The information will be presented in the letter in a detailed manner, and in SMS in a compact manner
- The next message will be sent only if a parameter has changed again
- If during the polling process it is found out that the device being polled is inactive (an error occurred while connecting to the device or an error occurred during parameter acquisition), this will be marked by the module and in the next several startup cycles (default: 5) this device will not be polled, so as not to create delays in polling other parameters.
- For devices from which parameters were retrieved, the date of the last activity will be updated.
- If an invalid parameter (OID) is specified, when polling a device, polling of this device will be stopped on this parameter.
If the module has stopped starting - a corresponding message will be displayed on the main page for the operators having access to the system configuration

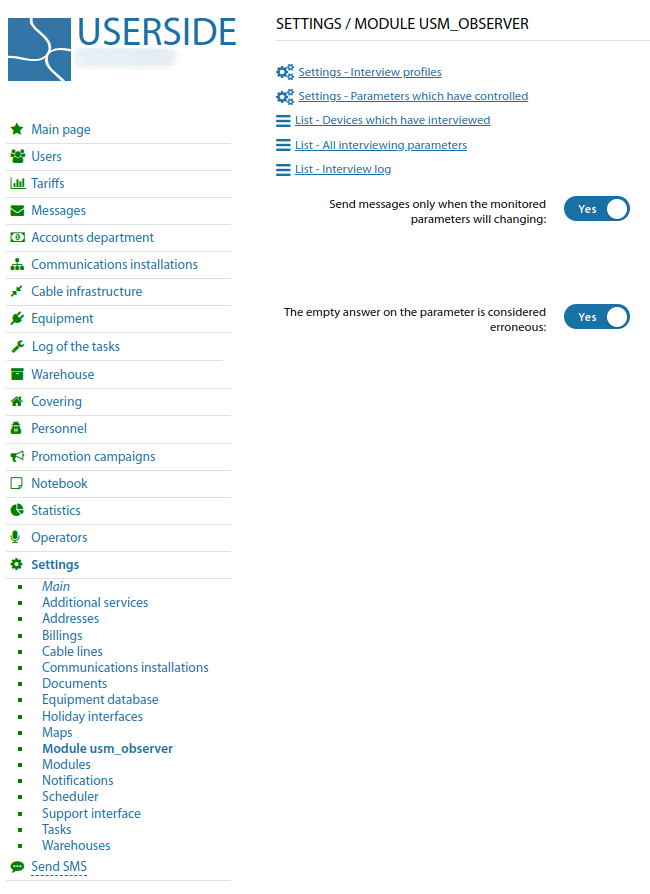
General Setup

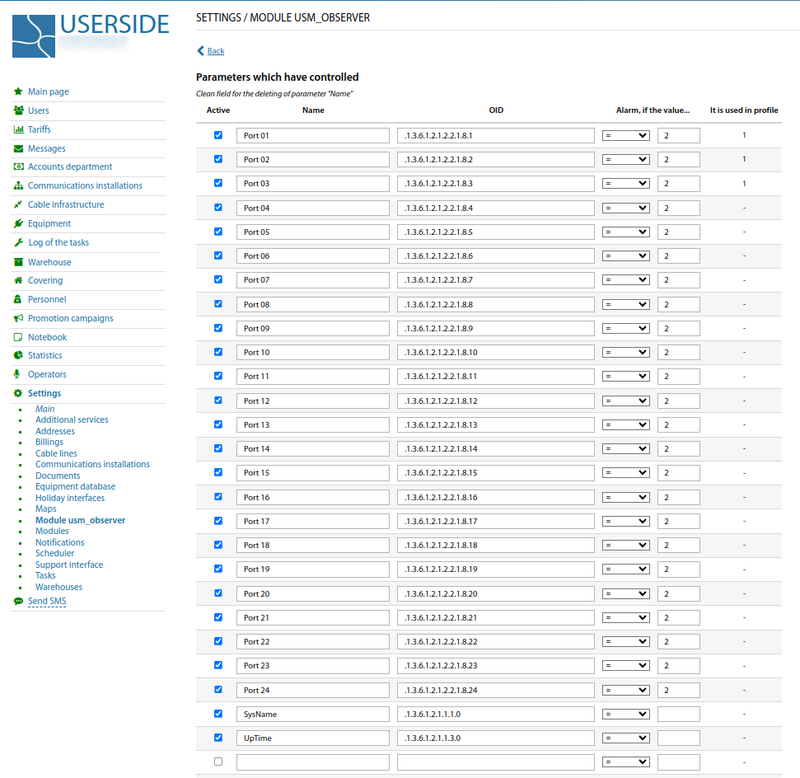
First, you need to specify a list of monitored parameters and the events at which to consider the values of these parameters to be out of normal.

Parameters can be compiled into polling profiles
For all parameters that are currently being polled, the current status and alarms can be viewed
There is a log of polled parameters (not all values, only their changes), which is stored in the system database.
The current list of polled devices is also available
Customisation in the device card
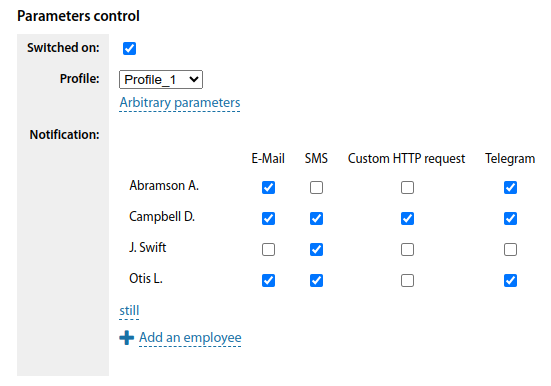
When editing the equipment card, a block is available where you can select a polling profile for this device, specify some individual parameters for polling that are not included in the selected profile, and specify the recipients of alarm messages

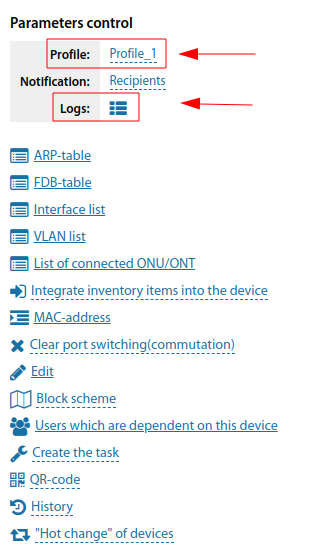
In the view mode, the module block is also displayed and from it you can view the current state of the parameters and the log of their state changes
