Addresses: различия между версиями
Нет описания правки |
|||
| (не показаны 3 промежуточные версии этого же участника) | |||
| Строка 1: | Строка 1: | ||
[[Addresses|en]] | [[Адреса|ru]] | [[Addresses|en]] | [[Адреса|ru]] | ||
''Covering - Addresses'' | |||
<youtube>https://www.youtube.com/watch?v=JocPMUbYnPU</youtube> | |||
The "Covering" - "Addresses" section contains a complete list of street and house addresses in the ERP "UserSide", with the number of users in each house and the time of the last activity for the house. There is colour highlighting of houses depending on [[Activity|Activity]]. Houses are grouped by coverage maps. | |||
[[File:2024-01-11_16-55.png||thumb|800px|center]] | |||
When you hover your mouse over a building number, a tooltip will show a summary of the building. | |||
<br> | |||
By clicking on a building number it is possible to navigate to its card. | |||
[[File:2024-01-11_16-56.png||thumb|800px|center]] | |||
The [[Address_system|Settings - Addresses]] section is where new address units are added, or existing address units are edited. | |||
[[File:2024-01-11_16-57.png|thumb|800px|center]] | |||
All buildings that are not marked on the map are displayed separately in the "The list of the buildings which was not marked on a map". | |||
[[File:2024-01-11_16-58.png||thumb|800px|center]] | |||
<br> | |||
It is possible to print out a list of these houses or output it in Excel. | |||
<br> | |||
The house data cards do not include coordinates / polygons. | |||
[[File:2024-01-11_16-59.png||thumb|800px|center]] | |||
<br> | |||
In the tab "The report about number of users in buildings" it is possible to view the report on penetration. It shows data on penetration, object owners, billing systems used, entrances, floors, flats. Separate columns represent * "Total Users" and ** "% penetration". | |||
[[File:2024-01-11_17-06.png||thumb|800px|center]] | |||
<br> | |||
* - It is separately marked active / inactive users for (days): 30. Disconnected users are not considered | |||
<br> | |||
** - Penetration percentage is calculated not according the number of users in the building, but according the number of connecting flats/offices | |||
<br> | |||
The "Buildings" tab displays the entire list of buildings. It is possible to use the quick search bar to find the required building. | |||
<br> | |||
It is possible to use the "Group actions" functionality to change the building type, add/remove marks and mass delete buildings. | |||
[[File:2024-01-11_17-07.png||thumb|800px|center]] | |||
<br> | |||
'''Starting from version 3.18:''' | |||
<span id="anchor_318_79_EN">Filtering by different parameters has been added to the addresses in the list of buildings.</span> | |||
[[File:2024-01-11_17-09.png||thumb|800px|center]] | |||
<br> | |||
'''Starting from version 3.19:''' | |||
<span id="anchor_319_14_EN">In the list of buildings, it is possible to filter by polygon on the map (select all buildings that are under the polygon)</span> | |||
[[File:2024-04-29 17-14.png|thumb|800px|center]] | |||
<span id="anchor_319_15_EN">The possibility to customize table fields has been added for the list of buildings</span> | |||
[[File:2024-04-29 17-16.png|thumb|800px|center]] | |||
Текущая версия от 14:25, 29 апреля 2024
Covering - Addresses
The "Covering" - "Addresses" section contains a complete list of street and house addresses in the ERP "UserSide", with the number of users in each house and the time of the last activity for the house. There is colour highlighting of houses depending on Activity. Houses are grouped by coverage maps.
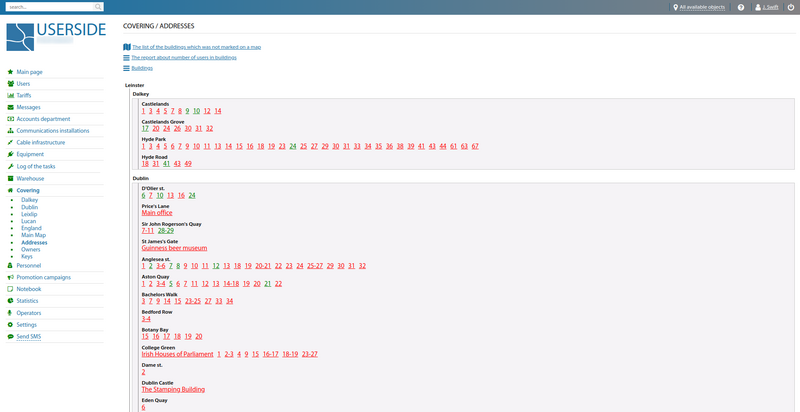
When you hover your mouse over a building number, a tooltip will show a summary of the building.
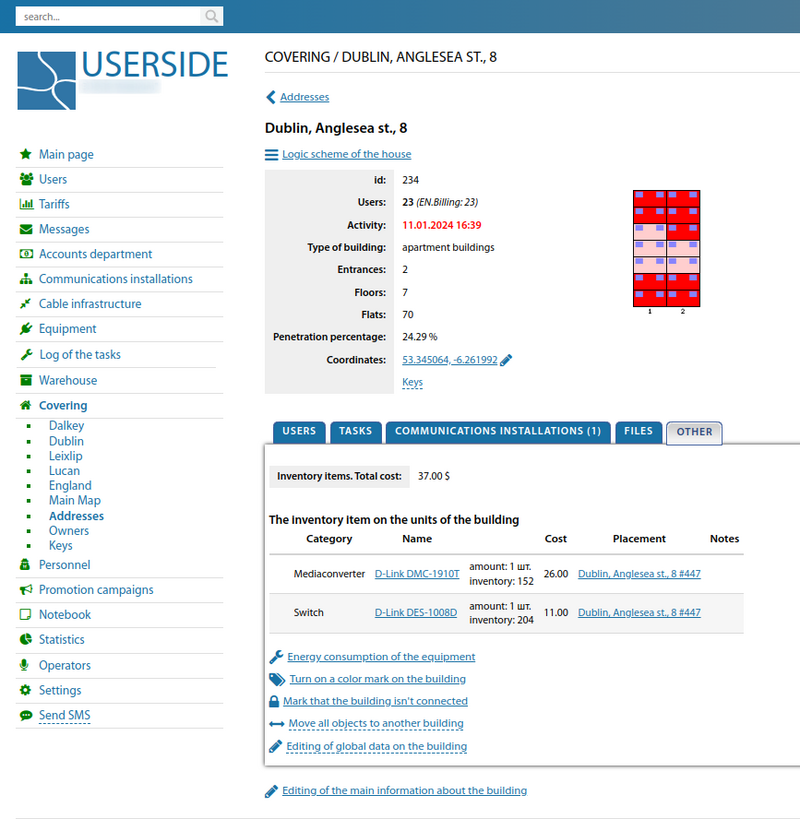
By clicking on a building number it is possible to navigate to its card.
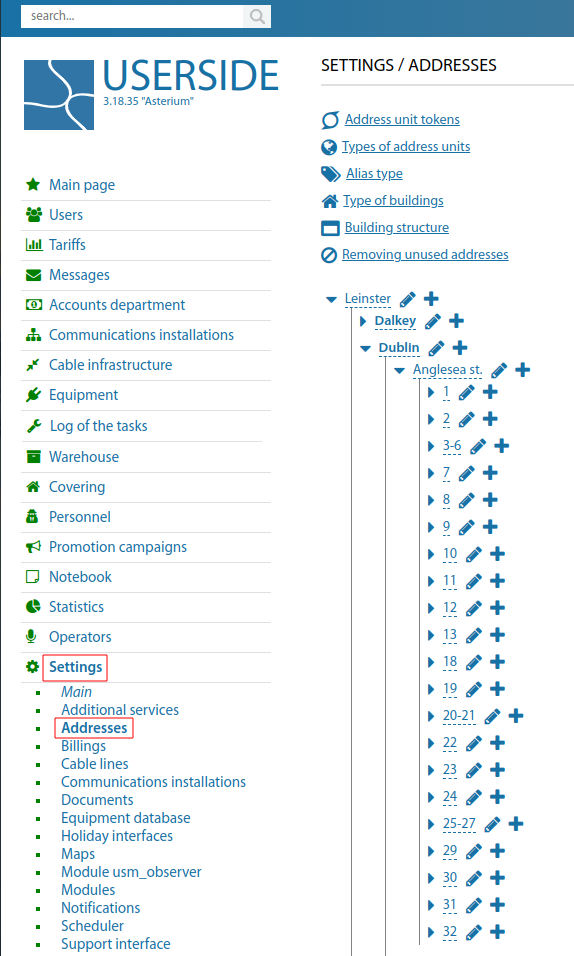
The Settings - Addresses section is where new address units are added, or existing address units are edited.
All buildings that are not marked on the map are displayed separately in the "The list of the buildings which was not marked on a map".
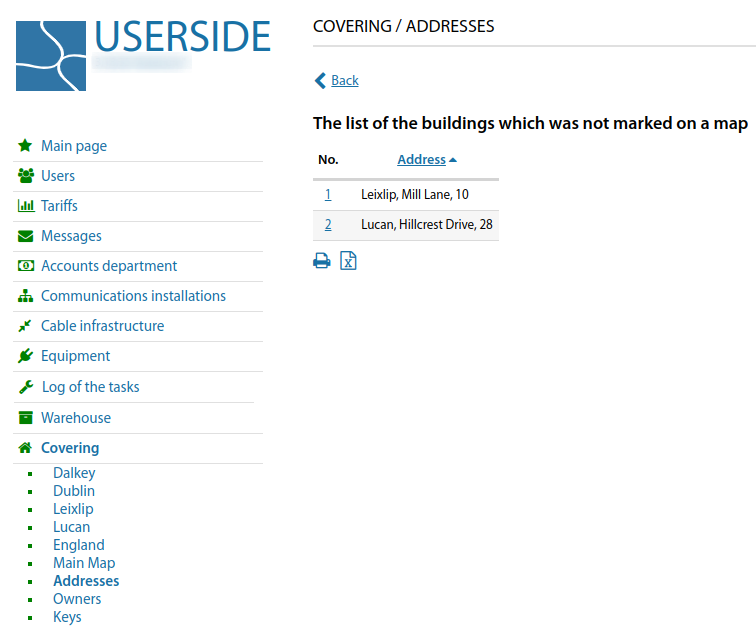
It is possible to print out a list of these houses or output it in Excel.
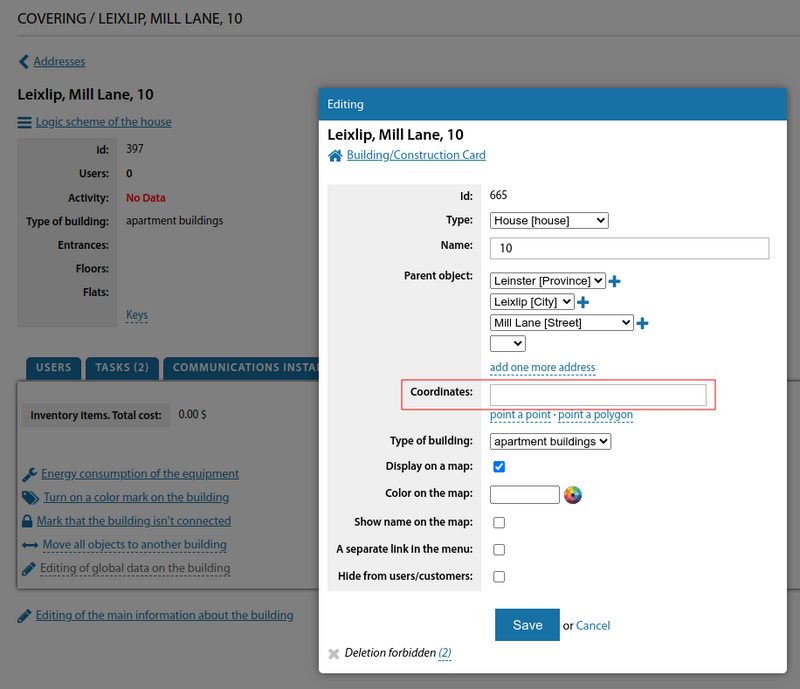
The house data cards do not include coordinates / polygons.
In the tab "The report about number of users in buildings" it is possible to view the report on penetration. It shows data on penetration, object owners, billing systems used, entrances, floors, flats. Separate columns represent * "Total Users" and ** "% penetration".
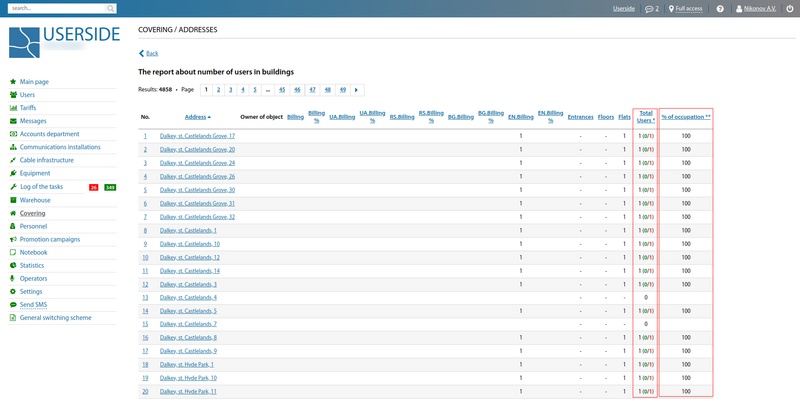
* - It is separately marked active / inactive users for (days): 30. Disconnected users are not considered
** - Penetration percentage is calculated not according the number of users in the building, but according the number of connecting flats/offices
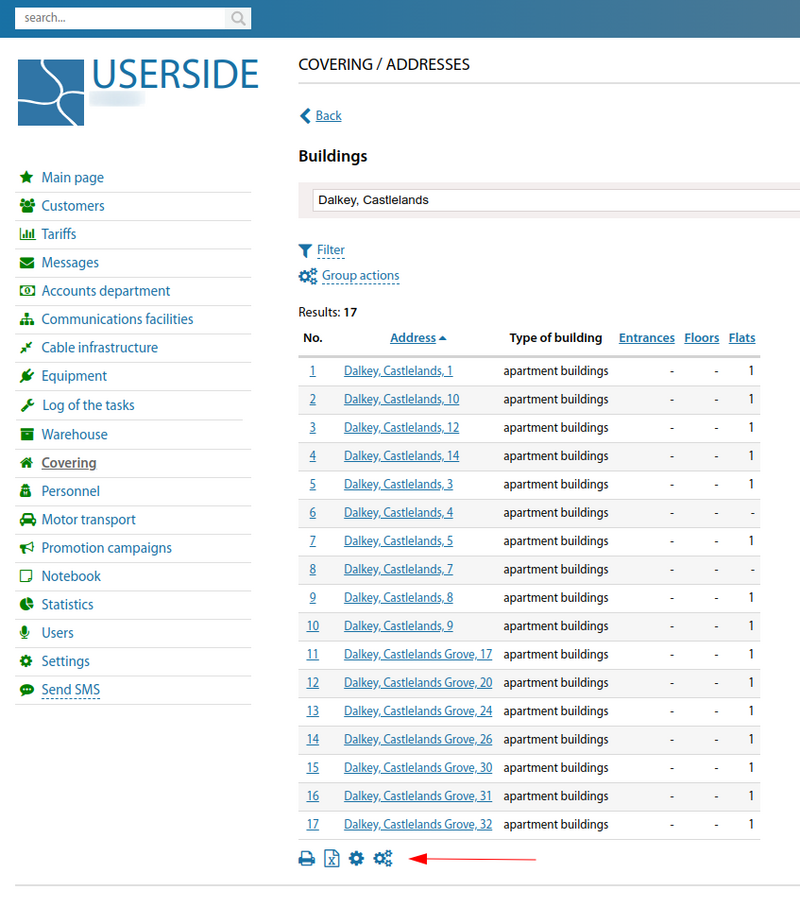
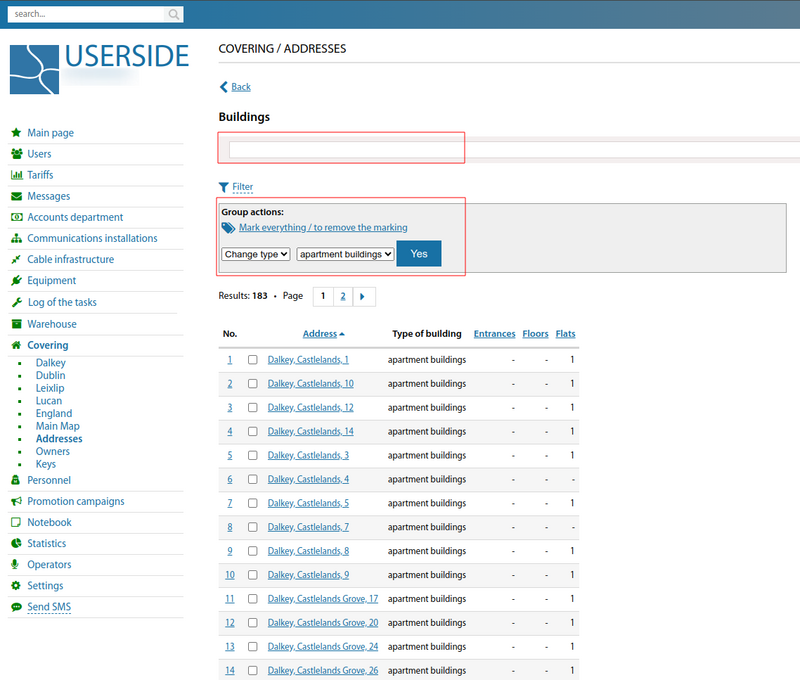
The "Buildings" tab displays the entire list of buildings. It is possible to use the quick search bar to find the required building.
It is possible to use the "Group actions" functionality to change the building type, add/remove marks and mass delete buildings.
Starting from version 3.18:
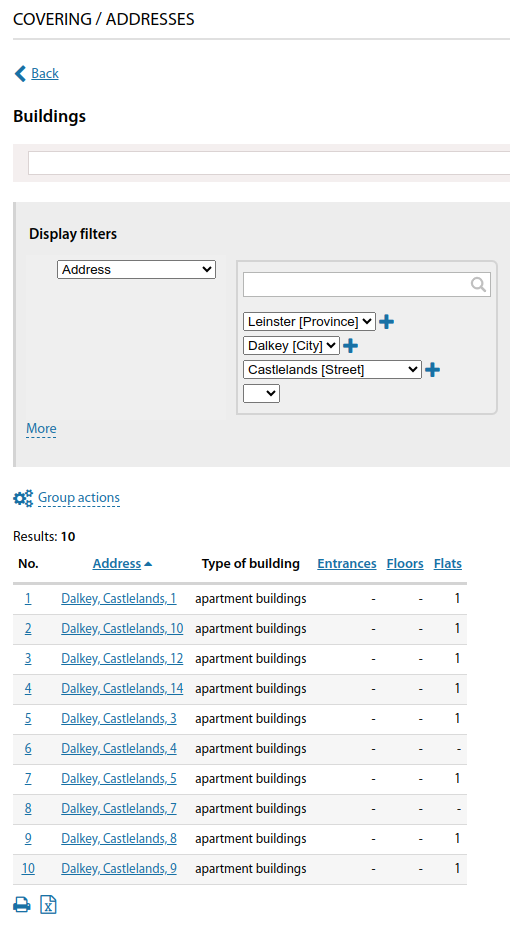
Filtering by different parameters has been added to the addresses in the list of buildings.
Starting from version 3.19:
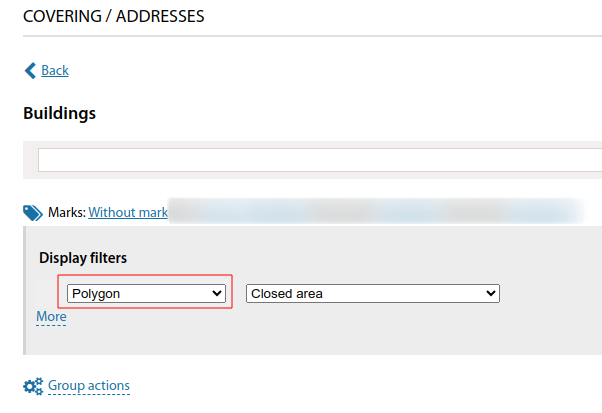
In the list of buildings, it is possible to filter by polygon on the map (select all buildings that are under the polygon)
The possibility to customize table fields has been added for the list of buildings
