Graph of growth: различия между версиями
Нет описания правки |
Нет описания правки |
||
| (не показана 1 промежуточная версия этого же участника) | |||
| Строка 1: | Строка 1: | ||
[[Graph_of_growth|en]] | [[График_роста|ru]] | [[Graph_of_growth|en]] | [[График_роста|ru]] | ||
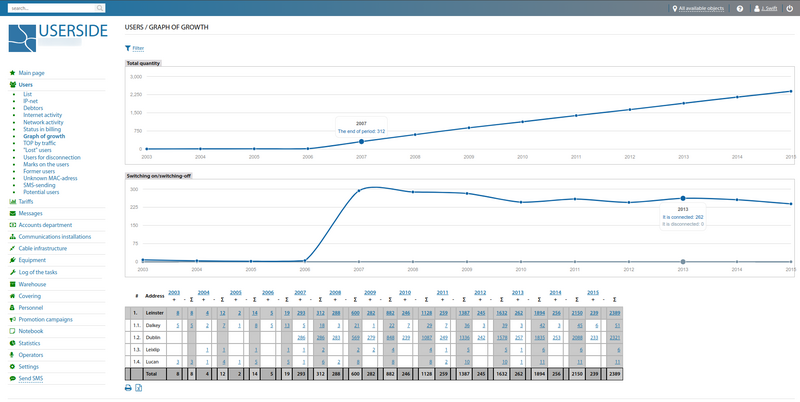
The dynamics of network growth are very important. It helps to understand how successful the network's expansion in the market is. This report graphically shows the monthly network growth, indicating the growth of | The dynamics of network growth are very important. It helps to understand how successful the network's expansion in the market is. This report graphically shows the monthly network growth, indicating the growth of customers for each specific month. In addition, the system shows which months were the most productive. | ||
[[File:2023-11-14_17-57.png|thumb| | [[File:2023-11-14_17-57.png|thumb|800px|center]] | ||
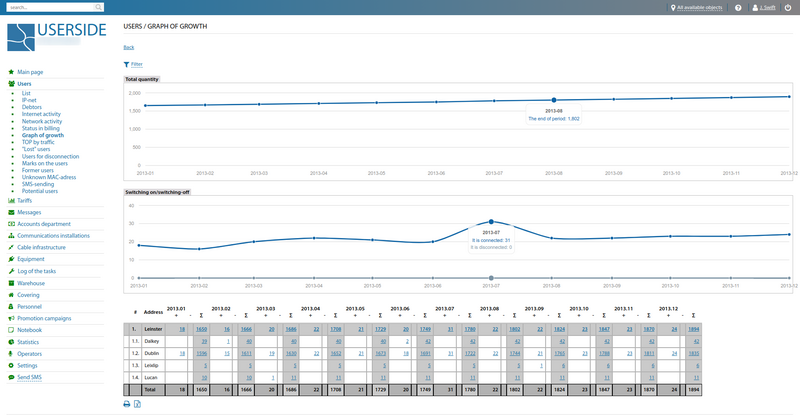
In addition, it is possible to view information for each year/month including by localities/districts/regions | In addition, it is possible to view information for each year/month including by localities/districts/regions | ||
[[File:2023-11-14_17-59.png|thumb| | [[File:2023-11-14_17-59.png|thumb|800px|center]] | ||
Текущая версия от 09:22, 8 ноября 2024
The dynamics of network growth are very important. It helps to understand how successful the network's expansion in the market is. This report graphically shows the monthly network growth, indicating the growth of customers for each specific month. In addition, the system shows which months were the most productive.

In addition, it is possible to view information for each year/month including by localities/districts/regions
